Here is the Report on performance in 2019 KCSE Chemistry Examination Papers from the Kenya National Examinations Council KNEC).
Chemistry is tested in three papers, paper I (233/1), paper 2 (233/2) and paper 3 (233/3). Paper I and paper 2 are theory papers while paper 3 is a practical. paper I (233/1 ) tests Forms I , 2, 3 and 4 content whereby each question carries a maximum of3 marks while paper 2 tests content from specific topics from forms l, 2, 3, and 4. A question in paper 2 can carry up to a minimum of 10 and a maximum of 14 marks. Paper 3 tests both quantitative and qualitative practical skills attained by the candidates from forms l, 2, 3 and 4.
This report is based on the analysis of performance of candidates who sat the year 2019 KCSE Chemistry.
KNEC REPORT ON CANDIDATES’ GENERAL PERFORMANCE IN THE 2019 KCSE CHEMISTRY EXAMS
The following table shows the performance of Chemistry in the last five years.
| Year | Paper | Candidature | Maximum Score | Mean Score | Standard Deviation |
| 2015 | 23Overall | 515,888 | 808040200 | 26.8322.0720.3768.71 | 15.7813.457.1533.29 |
| 2016 | 1 2 3Overall | 566,836 | 808040200 | 19.1514.6613.6347.42 | 14.8512.856.3134.01 |
| 2017 | 123Overall | 606,515 | 8080200 | 17.0317.9714.148.09 | 14.6714.326.11 |
| 2018 | 23Overall | 656,163 | 8080 | 19.3616.9614.4453.76 | 14.5714.176.4533.45 |
| 2019 | 1 23 | 691,802 | 808040200 | 20.0018.0013.0052.17 | 14.9813.076.7032.71 |
From the table, it is observable that:
(i) Candidature for chemistry increased from 656,163 in 2018 to 691 ,802 in 2019 an increment of about 5.4%. Candidature has been improving over the years.
(ii) Performance in paper 1 improved slightly with 0.64 units from a mean of 19.36 to a mean of 20.00. The increment was equivalent to 3.31 %;
- Performance in paper 2 improved minimally with 1.04 units from a mean of 16.96 in 2018 to 18.00 in 2019. This was an increase of 6.1%;
- Performance in paper 3 declined from a mean of 14.44 to 13.00 an equivalence decrease of 9.97%.
- The standard deviation in the theory papers remained near the ideal indicating that the lest items were able to discriminate between low and high achievers. The near-ideal SDs show that the papers were balanced in terms of difficulty versus easiness. However, the standard deviation of the practical paper was 6.70 which is small compared to the ideal standard deviation.
 The overall performance of Chemistry declined from a mean of 53.76 (26.88%) in 2018 to 52.17 (26.09%) in 2019 a decrease of I .59 points equivalent to 2.96%. Teachers are advised to teach the syllabus but not the textbooks in order to cover the entire content. A variety of textbooks authorized by the curriculum body should be used for instruction but not one recommended textbook.
ANALYSIS OF QUESTIONS PERFORMED POORLY
Questions that were performed poorly are analyzed and briefly discussed below. The discussion is based on comments from the chief examiners reports and analysis of the candidates’ responses from the sampled answer scripts.
Chemistry Paper 1 (233/1) 2019 KCSE KNEC Report
The questions which were reported to have been poorly performed are briefly discussed below in view of pointing out the candidates’ weaknesses and the proposed suggestions on the measures to be put in place in order to improve performance in future.
Question 7
A solution contains 40.3 g of substance XOH per litre. 25.0 cm3 of this solution required 30.0 cm3 of 0.3 M sulphuric (VI) acid for complete neutralization.
| (a) | Calculate the number of moles of XOH that reacted. | (11/2 marks) |
| (b) | Determine the relative atomic mass of X. | (1 1/2 marks) |
(O= 16.0; H= 1.0)
Requirements
Weaknesses
Many candidates had challenges in getting the mole ratio hence unable to use the moles of sulphuric (VI) acid to obtain the concentration of XOH.
Advice to teachers
Teachers should put emphasis on calculations involving molar solutions and present the learners with opportunities for more practice on questions on the mole and related questions.
Question 19
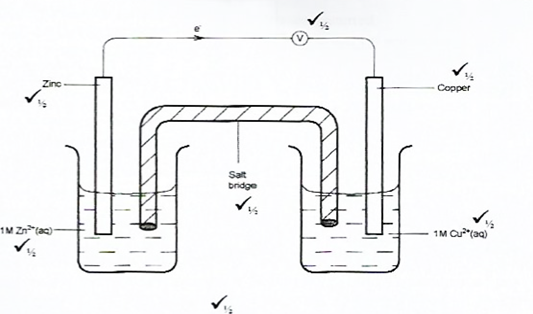
Given that the EO of Cu(s) /Cu2+(aq) is + 034 V and that of Zn(s)/Zn2+(aq) is – 0.76 V, draw a labelled diagram of zinc and copper electrochemical cell (3 marks)
Requirements
In this question, candidates were required to draw and label an electrochemical cell made of zinc and copper half-cells.
Weaknesses
The majority of the candidates could not draw the cell correctly and used a battery instead of a voltmeter.
Expected Response
Advice to teachers
Teachers should apply a practical approach when handling the topic of Electrochemistry so that the learners can be able to see the electrochemical cells practically and to be able to see how the cells are made
Question 28
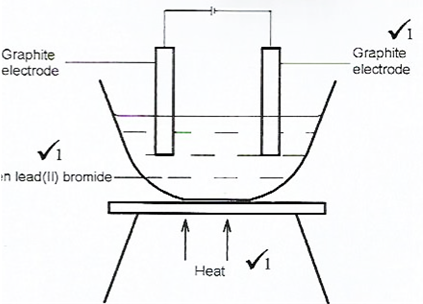
Draw in the space provided a labelled diagram of the set-up of the apparatus that can be used to electrolyse molten lead(ll) bromide. (3 marks)
Requirements
 These questions required candidates to draw the set-up of the apparatus used to electrolyze molten lead(ll) bromide.
Weaknesses
Most of the candidates failed to indicate heat in the setup. Others could not identify the type of electrodes suitable for the electrolysis.
Expected Responses
Advice to teachers
Teachers should apply practical approach when teaching electrolysis so that learners are able to interact with and see the actual set up of the apparatus.
Chemistry paper 2 (233/2) 2019 KCSE KNEC Report
Question 5
- What is meant by molar heat of neutralization? ( 1 mark)
- In an experiment to determine the molar heat of neutralisation, 50 cm3 of I M hydrochloric acid was neutralised by adding 10 cm; portions of dilute sodium hydroxide. During the experiment, the data in Table 1 was obtained.
Table
| Volume of Sodium hydroxide (cm3) | 10 | 20 | 30 | 40 | 50 | 60 | |
| Temperature of mixture | 25.0 | 27.0 | 29.0 | 31.0 | 31.0 | 30.0 | 29.0 |
- Write the equation for the reaction in this experiment. (l mark)
- On the grid provided, plot a graph of temperature (Y-axis) against volume of sodium hydroxide (x-axis) added. (3 marks)
- Determine from the graph the:
| I. volume of sodium hydroxide which completely neutralises 50.0 cm3 of 1.0M hydrochloric acid. | (1 mark) |
| ll. change in temperature, AT, when complete neutralisation occurred. | (l mark) |
- Calculate:
| I. the heat change, AH when complete neutralisation occurred.(Specific heat capacity = 4.2 Jg-l K-1, density of solution gcm-3)Il. molar heat of neutralisation of hydrochloric acid with sodium hydroxide. | (2 marks)(l mark) |
- How would the value of molar heat differ if50.0
 ethanoic acid was used instead of I .0M hydrochloric acid? Give a reason. (2 marks)
Requirements
The question required candidates to apply knowledge on enthalpy changes to draw a graph of the reaction and deduce some data from the graph.
Weaknesses
Majority of the candidates were not able to apply the knowledge of extrapolation to determine the highest temperature change but just used the highest and lowest temperatures from the table to determine AT.
Expected Responses
- Heat change that occurs when one mole of OH- ions reacts with one mole of H* ions to form 1 mole of water.
- (i)
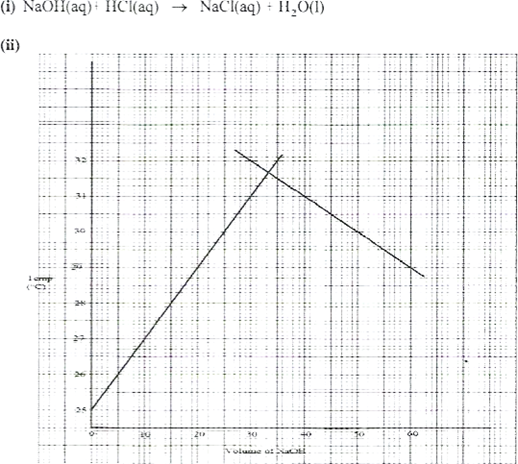
- I. Volume of sodium hydroxide (correct value read from the graph)From graph 33.5cm311. AT =
 = 6.65% /AT = value from the graph -25
 - l. AH =
 / value from the graph 50 x 4.2 x AT= 2332155 JSOX 1
11. Moles of HCI- OR Ans from (vi)l.
1000
0.05
 0.05
0.05
0.05 moles = 2332_2
2332.2
1 mole 
0.05
=- 46.64kJmOl-1
- The molar heat of ethanoic acid would be lower. Ethanoic acid is a weak acid and thus not some of the heat energy is utilized in ionizing the acid
Advice to teachers
Teachers should guide learners on skills for drawing graphs and apply practical approach in the teaching of this topic.
Question 7
- What is meant by rate of reaction? (1 mark)
- In the space provided, sketch the diagram of a set-up that can be used to determine the rate of reaction between manganese(IV) oxide and hydrogen peroxide. (3 marks)
- A student placed a small amount of liquid bromine at the bottom of a sealed gas jar of air as shown in Figure 4.
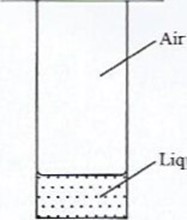 Liquid bromine
Figure 41. Describe what will bel. After two minutesIl. after 30 minutes2. Use the kinetic theory to explain the observations: (2 marks)
I. after 2 minutes
Il. after 30 minutes
(d) Some plants have seeds that contain vegetable oil.
(i) Describe how the oil can be obtained from the seeds. (3 marks) (ii) Explain how it could be confirmed that the liquid obtained from the seeds is oil. (1 mark)
Requirements
Candidates were required to define rate of a reaction, draw a set- up that can be used to investigate rate of decomposition of hydrogen peroxide using manganese(IV) oxide as a catalyst and to describe the observations made when bromine liquid diffuses.
Expected Responses
(a) Rate = change in concentration of reagents/products

Reaction rate is a measure of how much of reactants are consumed or how much products are formed per unit time.
(b)
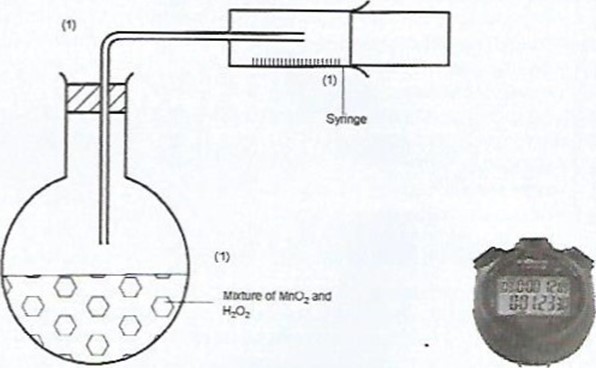
- Workability – I mark
- Means of measuring the gas – I mark
- Means of timing (stopwatch)(c) (i) I- After two minutes, red-brown colour fumes of bromine are observed on the surface of the bromine liquid
Il. After 30 minutes, the gas jar is filled with yellow fumes.
(ii) I. Bromine liquid is volatile, the molecules escape from the liquid but the vapour being denser than air will occupy the space on the surface of the liquid.
Il. Since molecules in the vapour phase move randomly, with time, bromine molecules will undergo collisions with air molecules and mix thus filling the gas jar.
- The seeds are crushed in a mortar with a pestle to increase surface area for oil extraction.
- Then a solvent (ethanol/acetone) is added with continued crushing. The liquid is then decanted into an evaporating dish.
- The evaporating dish is placed out into the sun to allow solvent to evaporate because of its low RMM, leaving behind the oil.
- The liquid left after evaporation is placed on a piece of paper. If it leaves a translucent mark, then it is oil
Advice to teachers
Teachers should apply practical approach when teaching rates of reactions and diffusion in air, liquid and solids.
Chemistry paper 3 (233/3) 2019 KCSE KNEC Report
The practical paper was tested using three questions. The question I tested skills and competencies on the rate of a reaction.
Question 1 tested Knowledge, skills, and competencies on:
- Manipulation of apparatus;
- Measuring volumes of solutions;
 Making observations;
 - Measuring temperature;
- Measuring, reading, and recording time using clocks /stopwatches;
- Data manipulation;
- Calculations;
- Drawing a graph rate of the reaction;
- Data interpretation.
Question 2 involved qualitative analysis of an inorganic compound while question 3 involved qualitative analysis of an organic liquid. The two questions demanded the candidates to perform experiments using appropriate apparatus, make accurate observations, record the observations made and infer correctly Majority of the candidates were able to make correct observations with quite a number of them not able to distinguish between a white precipitate from a white sublimate. However, the candidates experienced challenges in making inferences where they had difficulties in giving the correct inferences.
Question 1 was identified to have challenged most of the candidates
Question 1
You are provided with:
- Solution A: aqueous Iron (lll) sulphate.
- Solution B: aqueous potassium iodide_
- Solution C: a mixture of aqueous starch and sodium thiosulphate solution.
You are required to determine the rate of reaction between aqueous Iron(lll) sulphate (solution A) and aqueous potassium iodide (solution B).
Procedure:
- Place 5 test tubes on a test tube rack and label them I, 2, 3, 4, and 5. Fill a burette with solution A. To each test tube place 3 cm3ofsolution A from the burette.
- Clean the burette and fill it with solution B. Place 8 of solution B Into a 100 ml beaker from the burette.
- Using an ml measuring cylinder, add 2 cm3 of solution C to the beaker containing solution B followed by 7 cm3 of distilled water measured using the same 10 ml measuring cylinder.
- Pour the contents of test tube 1 to the mixture in the beaker and immediately start the stopwatch. Swirl the contents of the beaker. Record in table 1 the time taken for a blue colour to just appear. Measure the temperature of the final mixture and record it in the space provided. Wash the beaker and proceed to step (v).
- Place 6cm_3 of solution B into 100 ml beaker from the burette. Add 2 cm; of solution C followed by 9 cm; of distilled water. Add solution A in test tube 2 to the mixture in the beaker and immediately start the stopwatch. Swirl the contents of the beaker. Record in table 1 the time taken for a blue colour to just appear. This is experiment 2.
- Wash the beaker. Repeat step (v) with solution A in test tubes 3, 4 and 5 with corresponding volumes of solution B, solution C and distilled water as indicated in table 1 for experiments 3, 4 and 5.
(a) Temperature of final mixture ……………….. . oC(l mark)
Table
| Experiment | Volume (cm3) of | Time(seconds) | |||
| Solution A | Solution B | Solution C | DistilledWater | ||
| 1 | 3 | 8 | 2 | 7 | |
| 2 | 3 | 6 | 2 | 9 | |
| 3 | 3 | 5 | 2 | 10 | |
| 4 | 3 | 4 | 2 | 11 | |
| 5 | 3 | 3 | 2 | 12 |
(3 marks)
- Complete table 2 for each experiment by:
- calculating the square of volume of solution B, B2, and filling in the table.
- calculating the rate of reaction which is given by the expression Rate = s1 and filling in the table.
Table 2
| Experiment | B2 | Rate = s-1 |
(5 marks)
- Plot a graph of rate (y-axis) against B2-

- Using the graph, determine the time that it will take for the blue colour to appear if the
 experiment is repeated using the following mixture:Volume (cm3) ofSolution ASolution BSolution CDistilled water(2 marks)
- In this experiment, the rate of reaction was determined with respect to potassium iodide. Describe how the rate of the reaction can be determined with respect to Iron (lll) sulphate_ (2 marks)
Requirements
Candidates were required to manipulate apparatus to measure volumes of solutions, make the observations on colour change, measure and record temperature, measure and record time using clocks /stopwatches, manipulate data, perform some calculations, draw a graph of rate against B2 and interpret the graph.
Weaknesses
Majority of the candidates were unable to read and record time accurately, choose a suitable scale for the graph, interpret the graph, convert time to rate correctly, perform mathematical manipulations and describe experimental procedure correctly.
Expected Responses
- 22.50C
- Table 1
| Experiment | Time (seconds) |
| 1 | 14.1 |
| 2 | 220 |
| 3 | 32.0 |
| 4 | 49.0 |
| 5 | 782 |
- Table 2
| Experiment | B2 | Rate s-l |
| 1 | 64 | 70.9 |
| 2 | 36 | 45.5 |
| 3 | 25 | 31.3 |
| 4 | 16 | 20.4 |
| 5 | 9 | 12.8 |
Note: All points lie on a straight line except for B = 8, B2 = 64, rate = 70.9 s-1
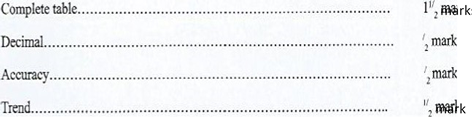
– Correctly worked B2………… . Y2 for each value to a maximum of 2 1/2 marks
– Correctly worked rate. ..1/ for each value to a maximum of 2 1/2 marks
(d)
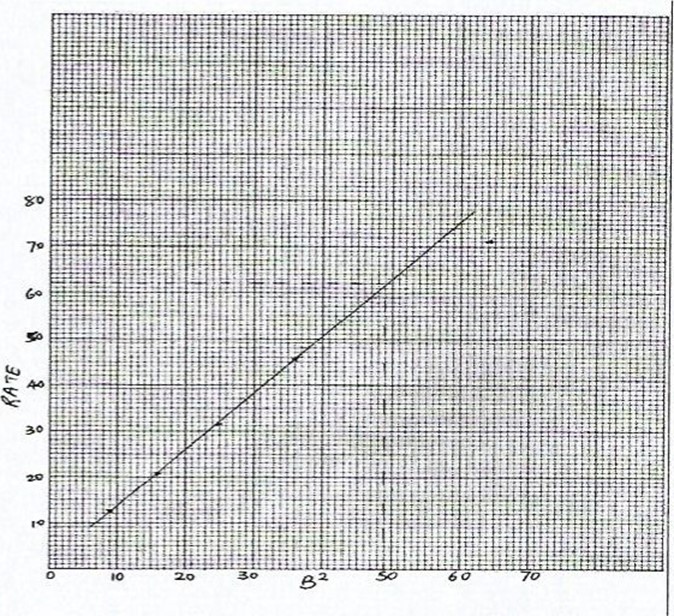
(e) B = 7, B2=49
From the graph, Rate = = 62
Time = — 16.1 seconds
(f) Keep the volume of solution B and solution C constant. Use different volumes of solution A. Calculate the appropriate volume of distilled water to use to make total volume constant.
Advice to teachers
Teachers should make use of a practical approach to the teaching and learning of Chemistry. Emphasis should be on calculations, manipulation of data, graph interpretation, and the use of correct scientific terms in reporting observations and inferences. Teachers are advised to expose learners to as many practices as possible in order to give them an opportunity to interact with apparatus and chemicals.
CONCLUSION
There was a decline in the performance of Chemistry in all three papers. It is worth noting that part of the practical examination involves the ability of the learners to follow instructions in carrying out the tests. Teachers should therefore train their learners to perform experiments with strict adherence to the instructions. This will enable them to attain the expected results without challenges.